Abstract
This study investigates whether a combination of retail investor sentiment (AAII weekly survey), options market positioning (CBOE Put/Call Ratio), and volatility regime (VIX/VVIX) generates a measurable, statistically defensible edge in predicting forward S&P 500 returns over horizons from four weeks to one year. The AAII bearish sentiment signal survives out-of-sample walk-forward validation at 8–52 week horizons (MWU p=0.000 at 52w, test period 2006–2026, parameters frozen at pre-2006 calibration).
The divergent fear composite signal — retail bearish while options market shows no confirming demand for protection — produces a 52-week in-sample median return of +22.0% versus a base of +9.9% (MWU p=0.000), but out-of-sample evidence is mixed. The VIX/VVIX regime overlay is directionally compelling but cannot be validated given insufficient VVIX history. Methodology includes corrections for overlapping return windows, non-overlapping binomial tests, permutation testing, and walk-forward out-of-sample validation. This is a working paper, not a finished research programme.
1. Executive Summary
This study investigates whether publicly available behavioural finance signals carry statistically defensible information about forward S&P 500 returns. The honest framing of what holds versus what does not is the most important contribution this paper makes.
1.1 What We Found
The AAII bearish sentiment signal is out-of-sample validated. Weeks where AAII bearishness is elevated relative to the prior two years show a statistically distinct and superior return distribution over 8–52 weeks on data the model never saw (MWU p=0.000 at 52w). Parameters calibrated exclusively on pre-2006 data, applied to 2006–2026.
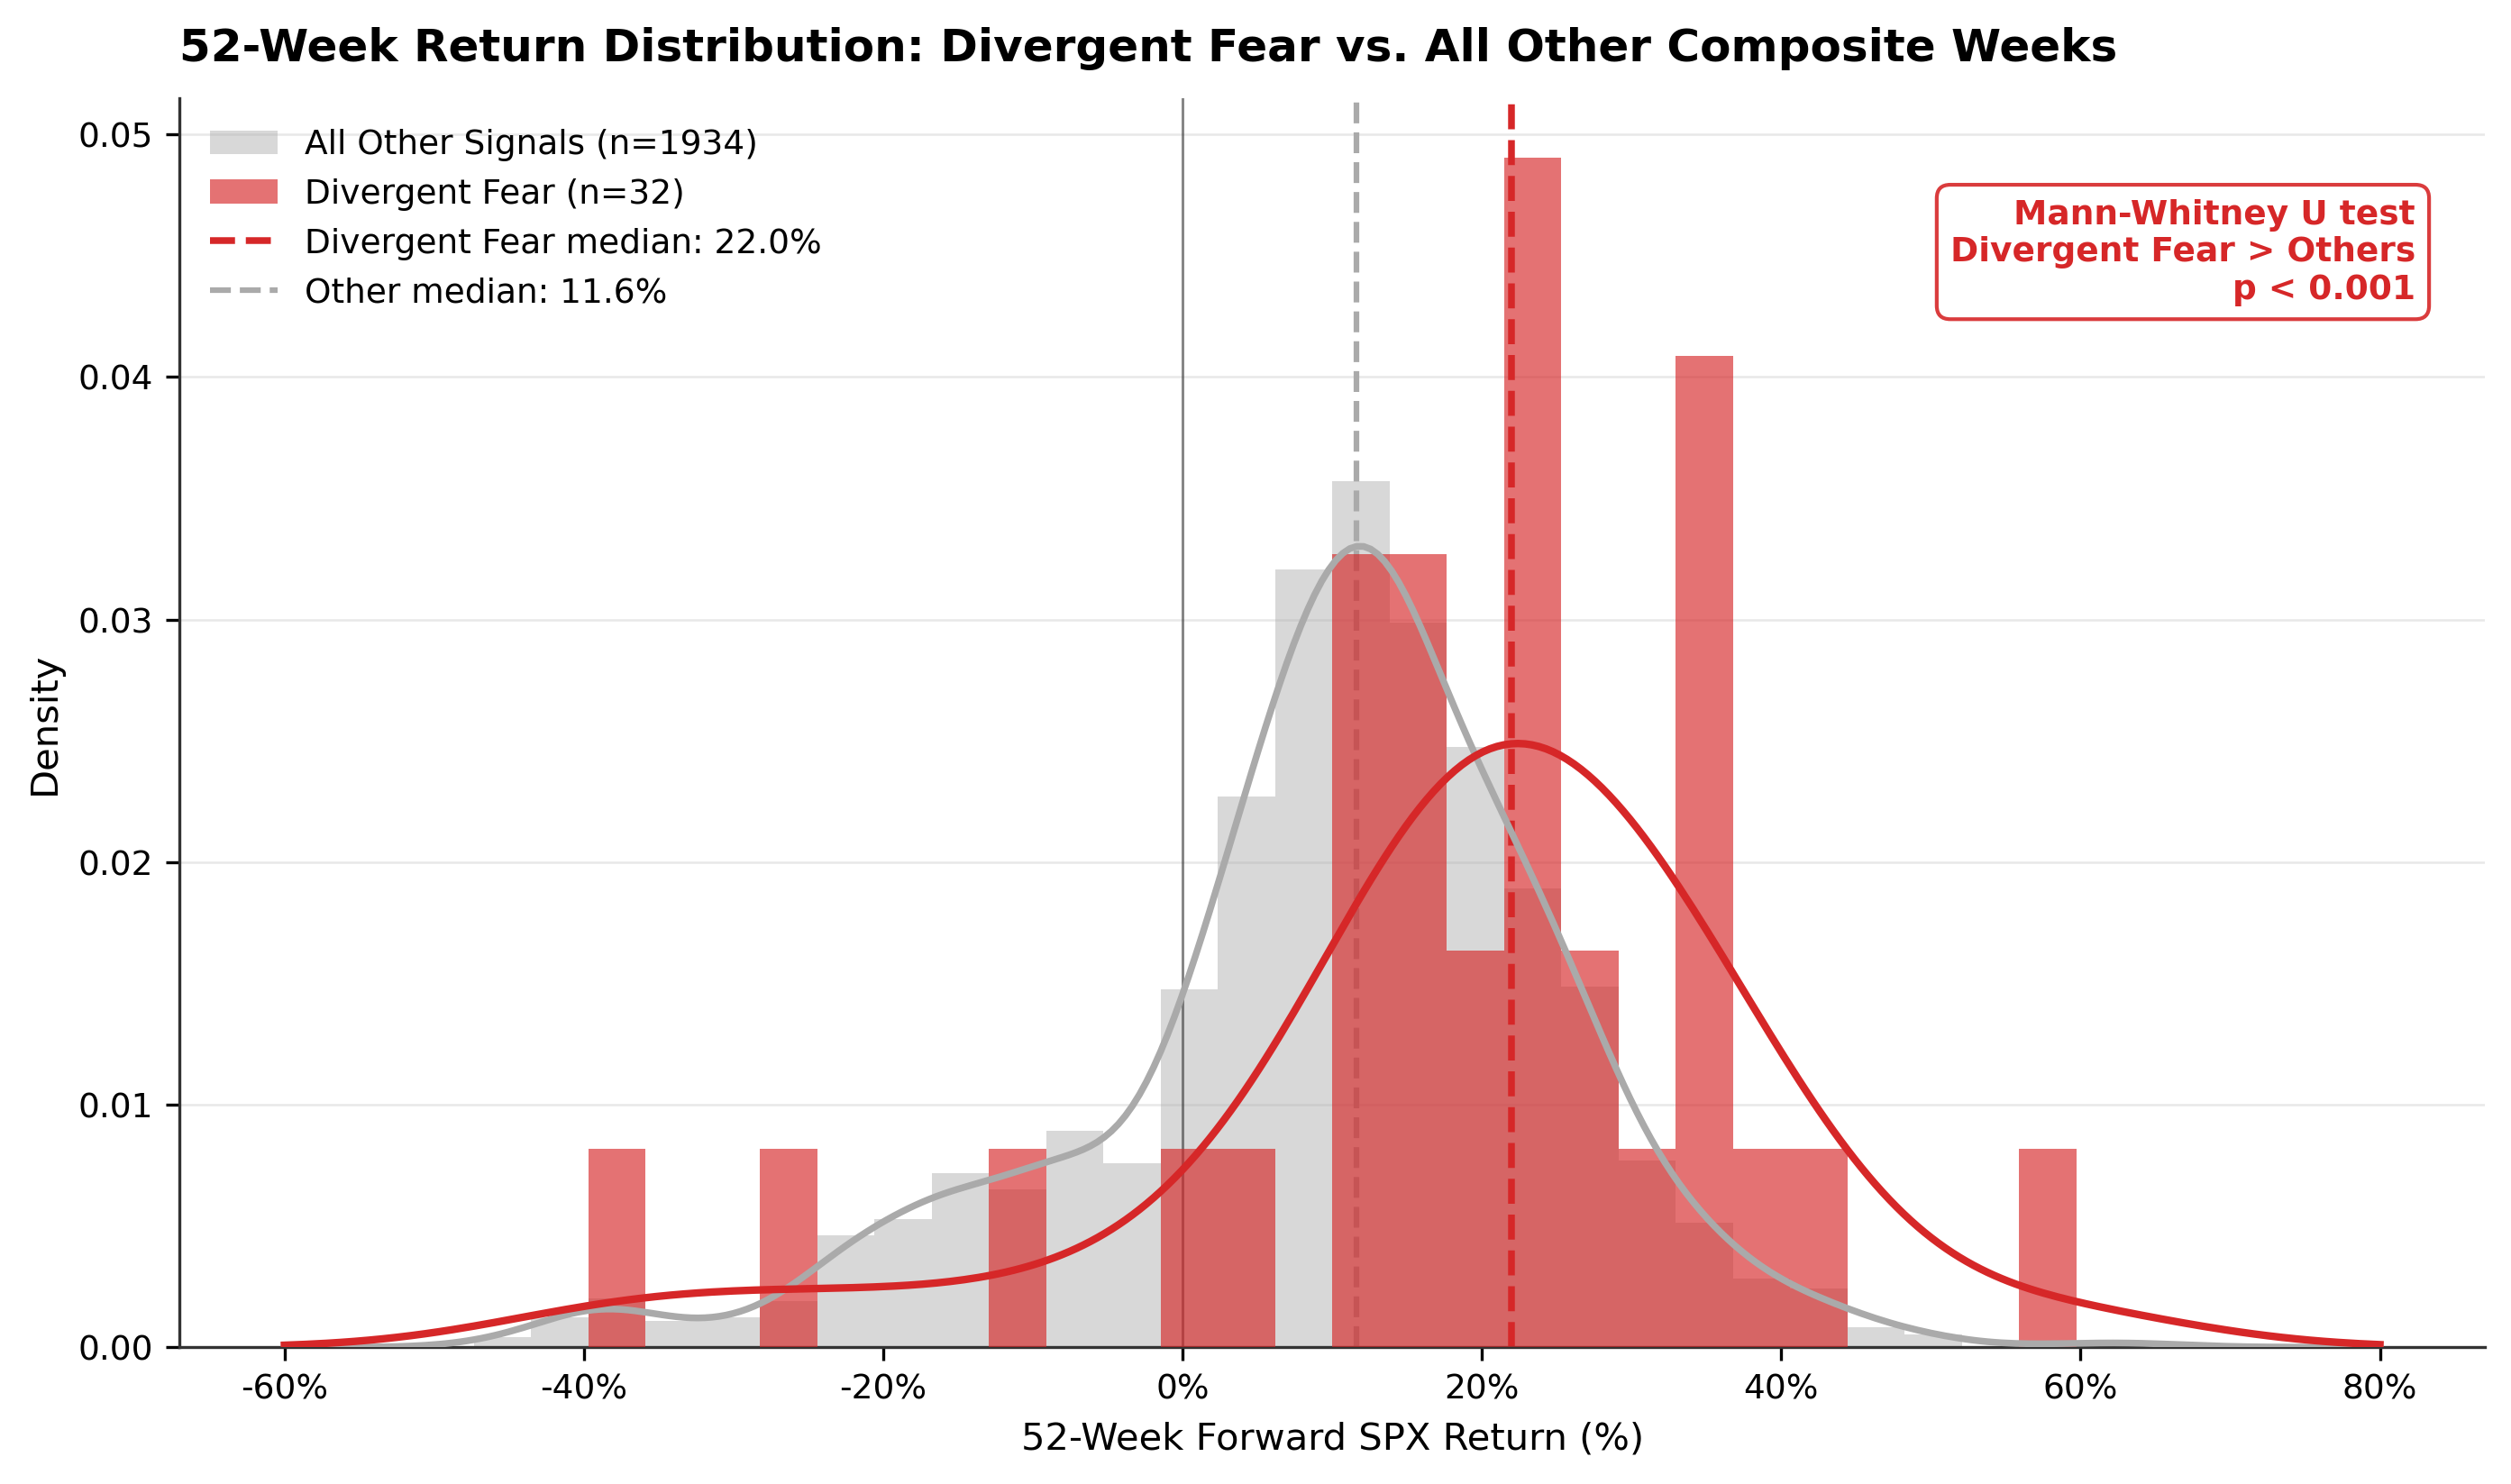
The divergent fear signal is the most compelling in-sample finding. When retail is verbally bearish but the options market shows no confirming demand for protection, the 52-week median return is +22.0% versus a base of +9.9% (MWU p=0.000 in-sample). Out-of-sample evidence for the composite signal is mixed.
The VIX/VVIX regime overlay cannot yet be validated. VVIX data begins only in 2012, leaving insufficient history for a meaningful walk-forward split. The regime analysis is in-sample only.
1.2 Core Findings at a Glance
Exhibit 1. Study claims and validation status
| Claim | Status |
|---|---|
| AAII fear predicts a different return distribution out-of-sample | Confirmed, MWU p=0.000, 8w through 52w |
| The return premium is economically significant | Modest, +0.9% to +2.0% above base at 12–52w |
| PCR divergence adds value over AAII alone | In-sample yes; out-of-sample mixed |
| Divergent fear has a statistically distinct return distribution | Confirmed in-sample — MWU p=0.000 |
| Continuous divergence score is a proven alpha factor | No, fails permutation test on full sample |
| VIX/VVIX regime sharpens the signal | Directionally yes; cannot validate out-of-sample |
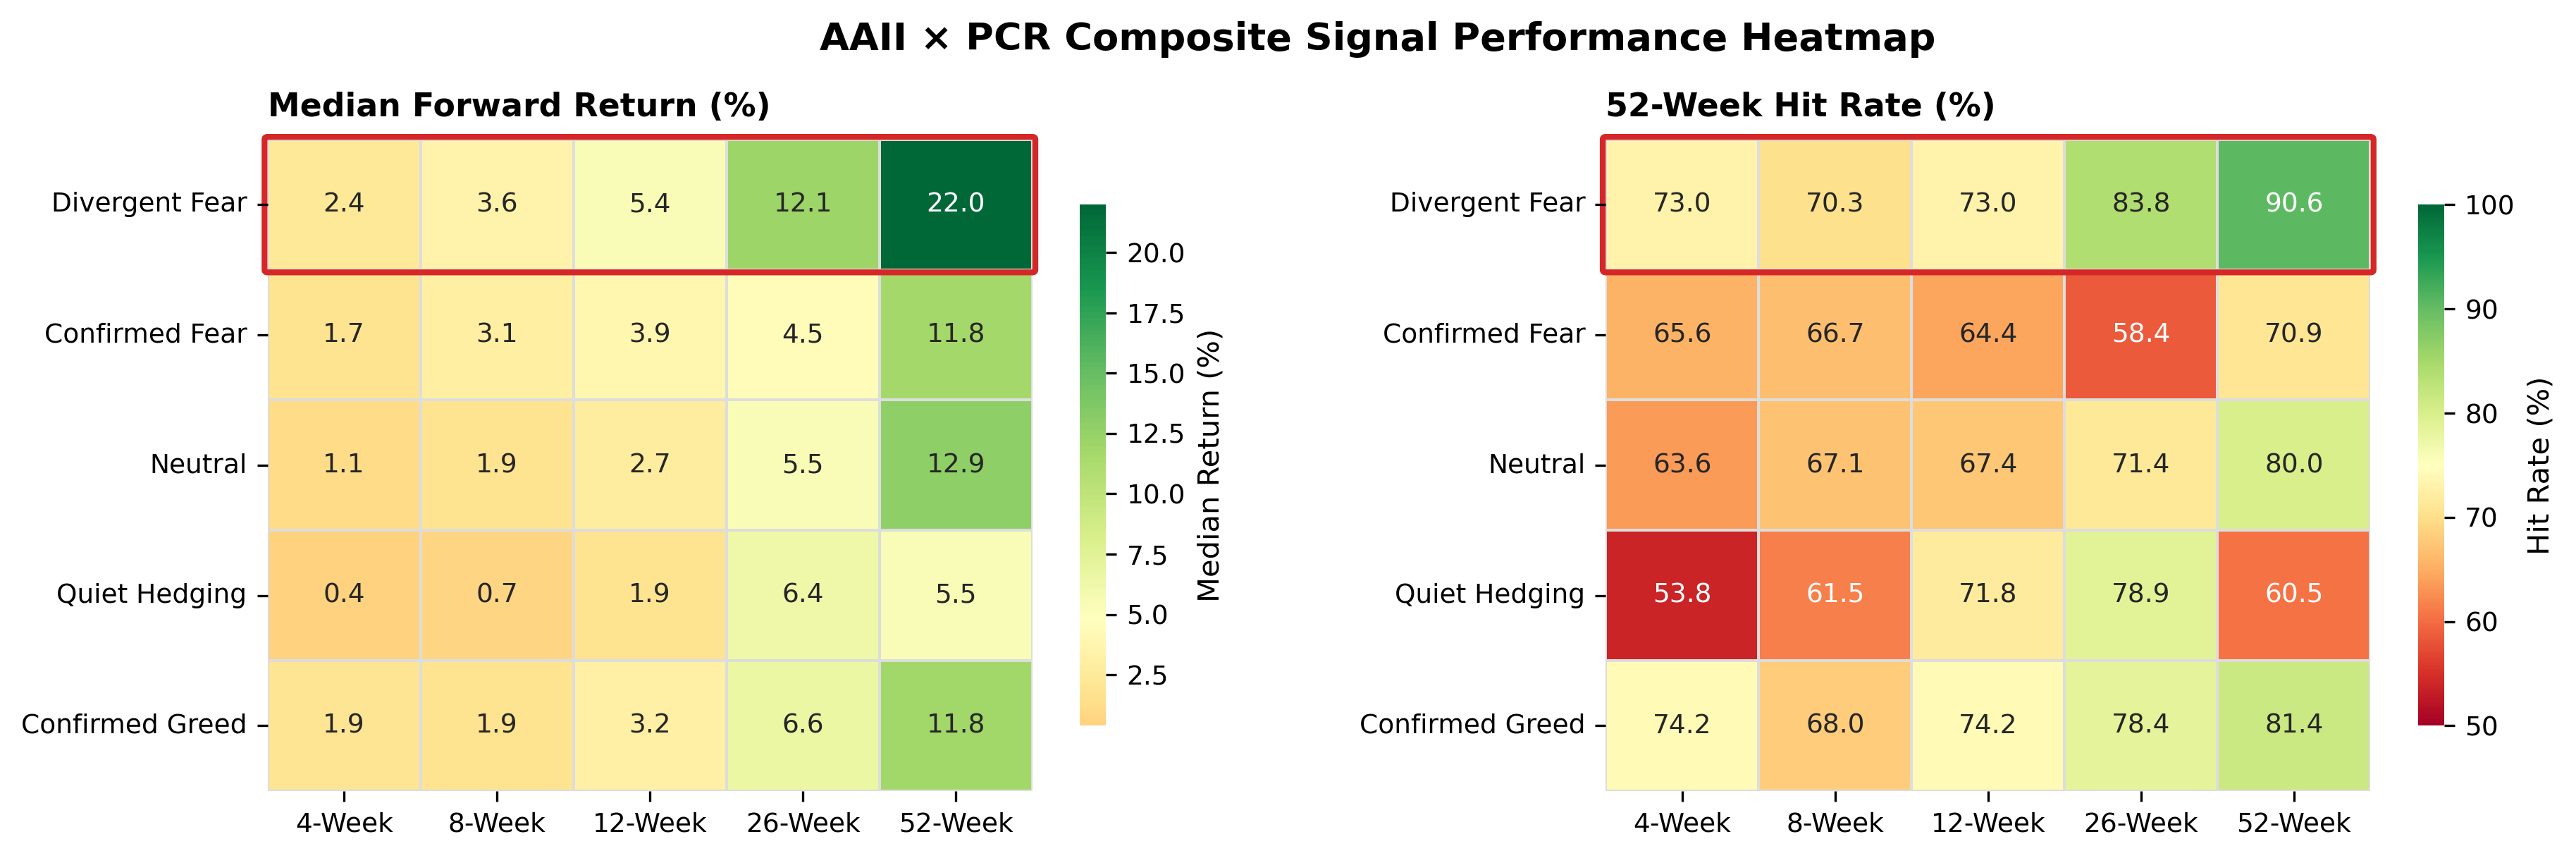
Exhibit 2. AAII × PCR composite signal performance heatmap
1.3 Disclaimers
This is a working paper, not a finished research study. While we used appropriate rigour in the methodology — proper significance testing, non-overlapping samples, permutation testing, and out-of-sample walk-forward validation — the scope is deliberately narrow. It tests three signals on index-level data over a single geography without controlling for valuation, macro regime, or factor exposures. This is a surface investigation into what behavioural signals can offer to traditional finance. We outlined five directions in Section 11, which we will take as the next steps.
2. Introduction
Behavioral finance has produced a substantial body of evidence that investor sentiment affects asset prices. It has been shown that fear and greed leave measurable imprints on market returns that traditional, and rational, models alone cannot explain. The AAII Investor Sentiment Survey, published weekly since 1987, is one of the most widely cited proxies for retail investor psychology. The CBOE Put/Call Ratio provides a complementary window into how investors position, as opposed to how they say they feel. VIX and VVIX capture the broader volatility regime.
The central research question is this: can a combination of these three publicly available data sources generate a measurable, statistically defensible edge in predicting forward S&P 500 returns? We did not set out to build a trading system nor a guaranteed alpha stream. Rather, we asked: do these signals carry information that is not already fully priced in?
The answer is: the AAII sentiment signal carries real information. The composite signals carry additional information in-sample that has not been fully confirmed out-of-sample. The vol regime layer carries interesting information that cannot yet be properly tested.
We did not construct a trading strategy nor do we claim to have discovered an exploitable market inefficiency. However, we have established what can be said with genuine statistical confidence about these signals, applied proper corrections for the methodological hazards specific to return-predictability research, and are honest about the limits of what the data supports.
3. Data
Four data series form the foundation of this study.
Exhibit 3. Data sources, coverage, and observation counts
| Series | Source | Range | Observations |
|---|---|---|---|
| AAII Weekly Sentiment Survey | American Association of Individual Investors | 1987–2026 | 2,018 weeks |
| CBOE Total Put/Call Ratio ($CPC) | Barchart | 2006–2026 | ~4,880 days |
| CBOE Volatility Index (VIX) | Barchart | 2000–2026 | ~6,760 days |
| CBOE Volatility of Volatility Index (VVIX) | Barchart | 2012–2026 | ~3,640 days |
The AAII survey asks individual investors weekly whether they are bullish, neutral, or bearish on the market over the next six months. This study focuses on the bearish reading as the primary signal of interest. The CBOE Total Put/Call Ratio measures aggregate options positioning. High readings indicate net protection-buying. Daily readings are aligned to the weekly AAII survey date. VVIX measures the volatility of VIX itself, used here as a proxy for institutional positioning anxiety. The shorter VVIX history (from 2012) is the constraint on the regime-overlay analysis.
4. Signal Architecture
The framework operates in three distinct layers.
4.1 Layer 1: The Divergence Score
The core quantitative signal:
divergence_score = bearish_z − pcr_z
bearish_z is the rolling 2-year z-score of the AAII weekly bearish reading, measuring how extreme current retail pessimism is relative to the prior 104 weeks.
pcr_z is the rolling 63-day z-score of the CBOE Total Put/Call Ratio, measuring how much options protection is being purchased relative to recent norms.
The divergence score captures the mismatch between what retail investors say and what the options market does. A high divergence score means retail is verbally bearish but the options market is not confirming it: nobody is paying for protection at an elevated rate. The thesis is that sentiment-driven fear without structural hedging confirmation tends to resolve upward; such regimes tend to be short-lived.
4.2 Layer 2: AAII × PCR Composite Buckets
Each week is classified into one of four named states by crossing the AAII signal with the PCR signal:
Exhibit 4. AAII × PCR composite signal state definitions
| Signal | AAII Reading | PCR Reading | Interpretation |
|---|---|---|---|
| confirmed_fear | Bearish (z > 1) | Elevated (z > 1) | Retail scared; options market confirms fear |
| divergent_fear | Bearish (z > 1) | Low (z < 0) | Retail scared; nobody buying protection |
| quiet_hedging | Bullish (z < 0) | Elevated (z > 1) | Retail complacent; institutions quietly hedging |
| confirmed_greed | Bullish (z < 0) | Low (z < 0) | Universal complacency; no fear anywhere |
4.3 Layer 3: VIX/VVIX Regime Overlay
Four volatility regime quadrants using 252-day rolling z-scores of VIX and VVIX. This layer does not generate a signal independently; it provides context for the divergence score. Because VVIX data begins only in 2012, the regime overlay could not be validated out-of-sample.
Exhibit 5. VIX/VVIX regime quadrant definitions
| Regime | VIX z | VVIX z | Interpretation |
|---|---|---|---|
| consensus_low | Below avg | Below avg | Structural vol suppression; broadly calm |
| latent_tension | Below avg | Above avg | Surface calm; regime uncertainty rising; divergence signal |
| active_fear | Above avg | Above avg | Broad structural fear; spot vol and meta-vol elevated |
| exhaustion | Above avg | Below avg | VIX elevated but vol-of-vol calming; fear may be peaking |
5. Methodology
5.1 Return Construction
Forward S&P 500 returns are calculated at five horizons: 4, 8, 12, 26, and 52 weeks from the weekly AAII survey close date. All horizons are computed for every weekly observation, producing overlapping return windows. This is a structural issue addressed directly in the significance testing design.
5.2 Statistical Tests
The two core problems in return-predictability research
Problem 1 — Overlapping return windows
Weekly observations with 52-week forward returns share approximately 51 weeks with their immediate neighbours. Standard tests applied to this data produce artificially low p-values. This study corrects by: (a) filtering to non-overlapping observations for binomial tests, and (b) using Newey-West HAC standard errors in regression, with lag lengths equal to the horizon.
Problem 2 — The equity base rate
The S&P 500 rises in approximately 75–80% of all 52-week periods regardless of any signal. A 90% hit rate must be tested against an ~84% unconditional base rate. With N=9 non-overlapping observations for divergent_fear at 52w, the binomial test has almost no power. This is stated explicitly throughout.
Tests applied
Mann-Whitney U (two-sided)
Tests whether a signal bucket's return distribution differs from all other periods. Non-parametric; primary significance test throughout.
Binomial test (one-sided)
Tests whether a bucket's hit rate exceeds the unconditional SPX base rate, on non-overlapping observations only. Explicitly noted as underpowered given available sample sizes.
Newey-West HAC regression
Continuous divergence_score regressed against forward returns with autocorrelation-corrected standard errors using lag lengths equal to the return horizon.
Permutation test
Signal labels shuffled 1,000 times; regression re-run on each shuffle. Observed coefficient compared to the empirical null distribution to detect period-selection artefacts.
Walk-forward out-of-sample validation
Parameters calibrated on a training period, frozen, and applied to a held-out test period. Gold standard for signal validation.
6. Results
6.1 AAII-Only Forward Returns
The baseline analysis classifies each week by AAII bearish reading into five buckets and computes forward SPX returns over 2,018 weeks of history.
Exhibit 6. AAII sentiment buckets: forward S&P 500 returns, 1986–2026
| Signal | N | 12w Median | 52w Median | 52w Hit Rate |
|---|---|---|---|---|
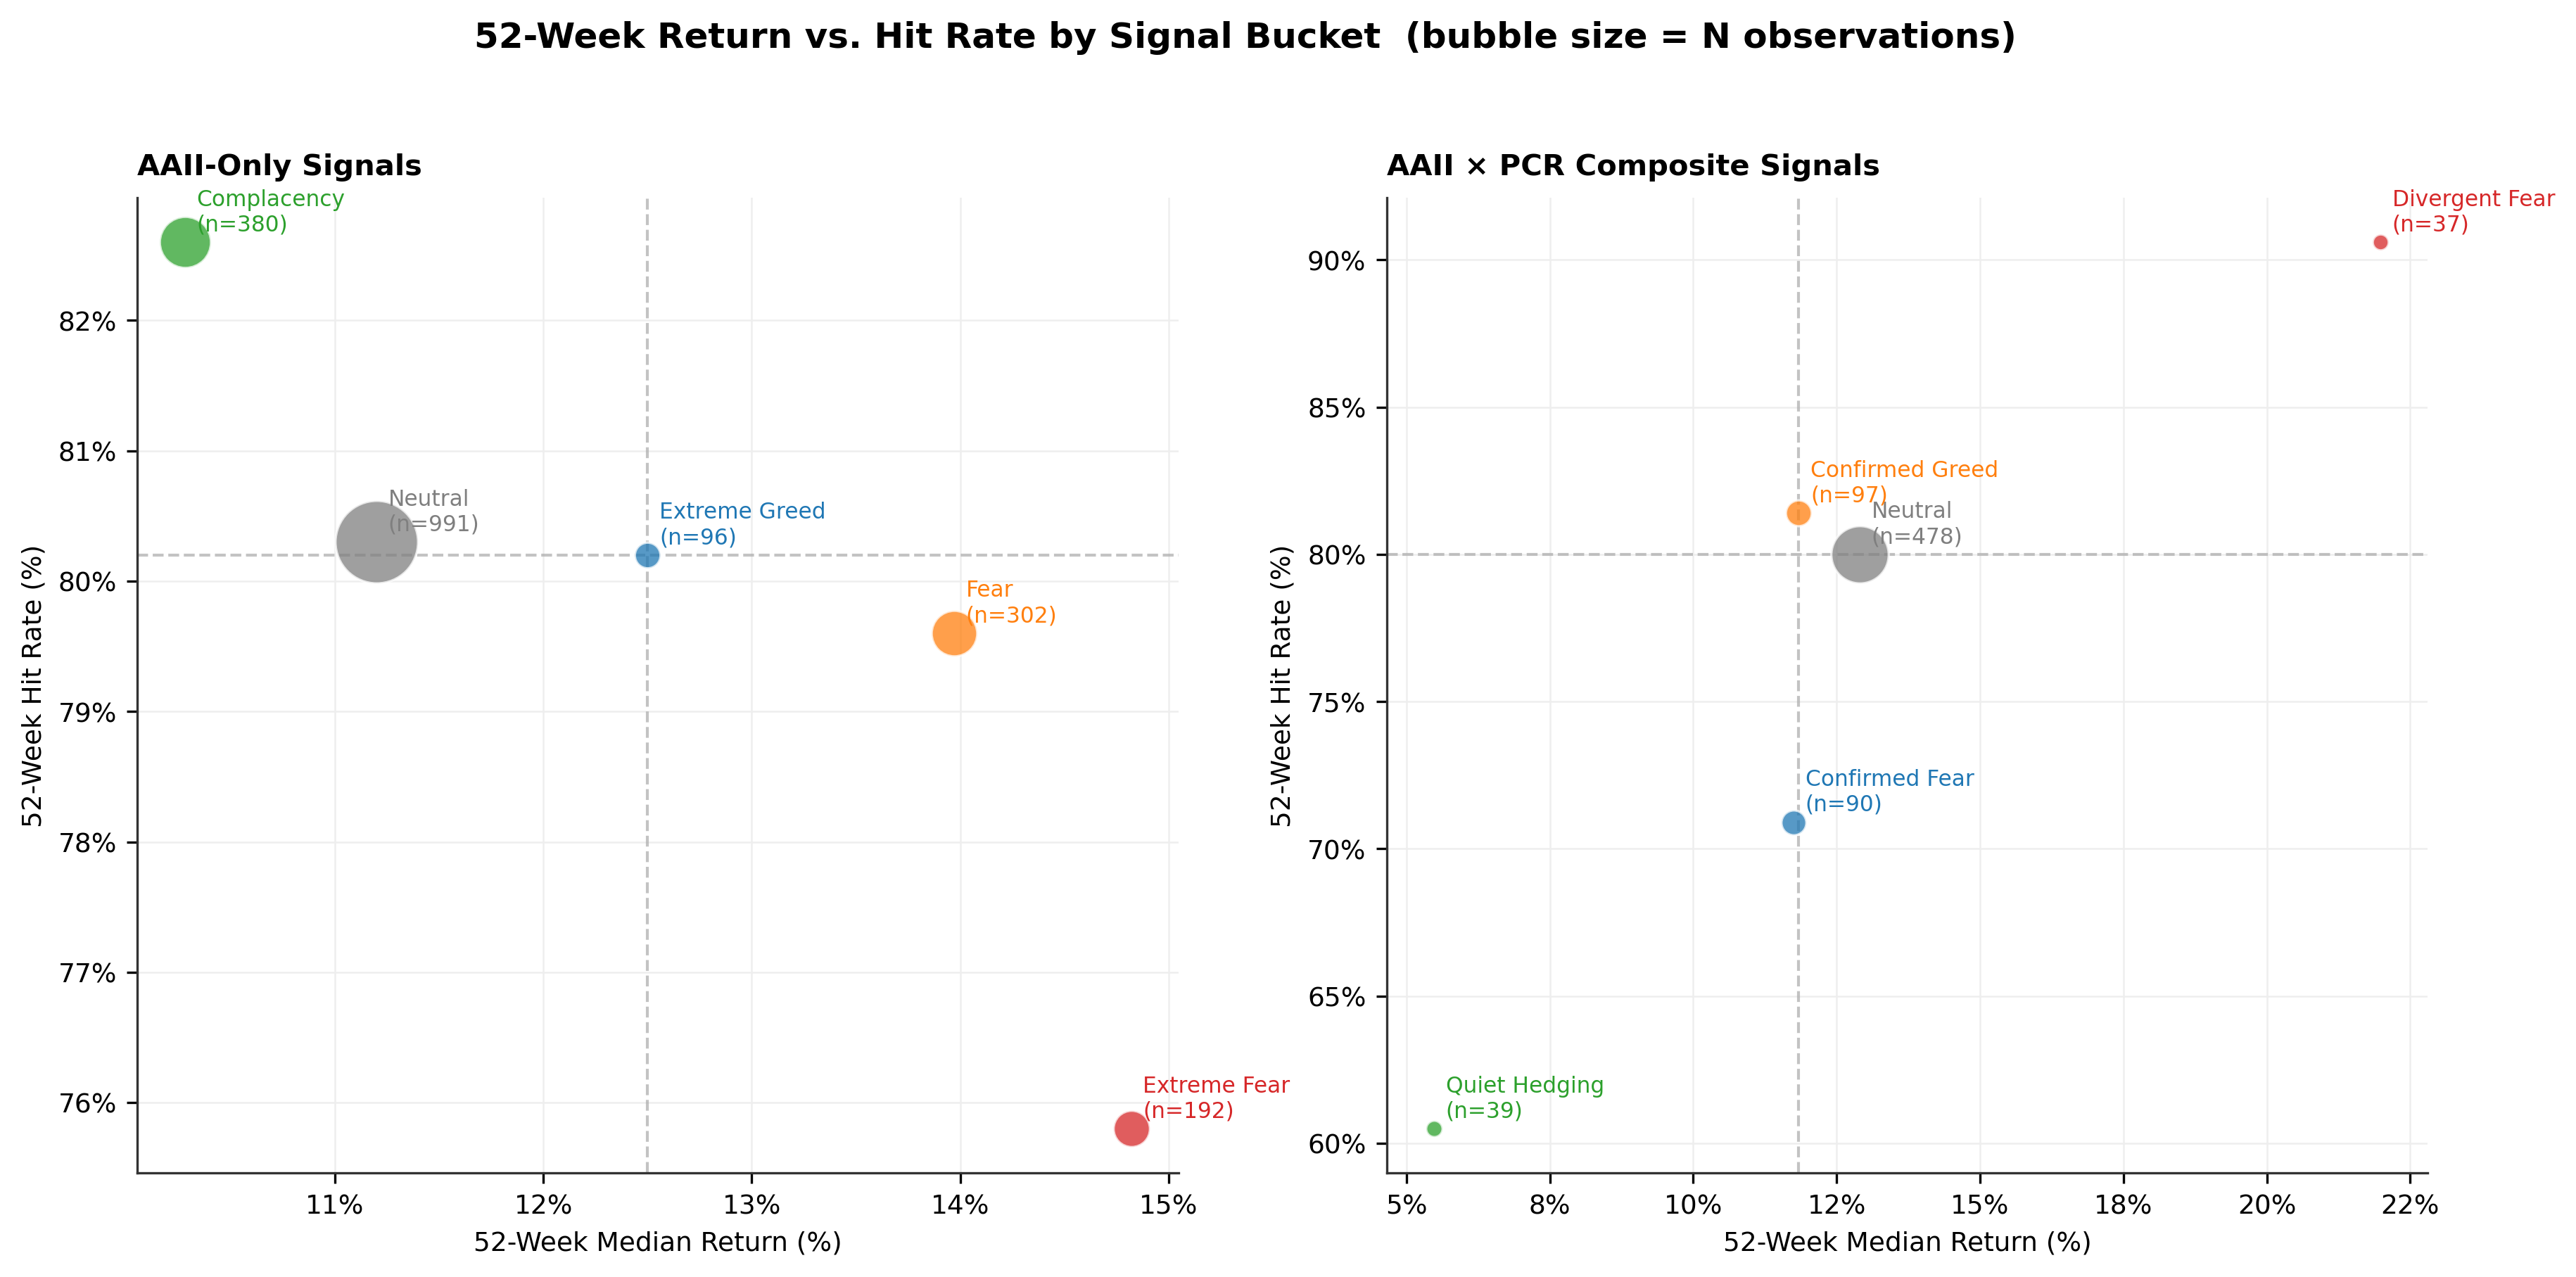
| extreme_fear | 192 | +4.2% | +14.8% | 75.8% |
| fear | 302 | +3.9% | +14.0% | 79.6% |
| neutral | 991 | +2.4% | +11.2% | 80.3% |
| complacency | 380 | +3.2% | +10.3% | 82.6% |
| extreme_greed | 96 | +3.2% | +12.5% | 80.2% |
Hit rate is the percentage of periods with positive 52-week forward return.
From the backtests, it can be confirmed that through AAII sentiment alone, we can correctly predict direction: fear periods show higher forward returns at longer horizons than complacency periods. But the differences are modest. Extreme fear at 52w produces +14.8% versus +10.3% for complacency. AAII alone is consistent but not dramatic.
6.2 AAII × PCR Composite Forward Returns
Adding the PCR overlay sharpens the picture considerably, particularly for the divergent_fear state.
Exhibit 7. AAII % bearish and S&P 500 with divergent fear signal highlights, 2006–2026
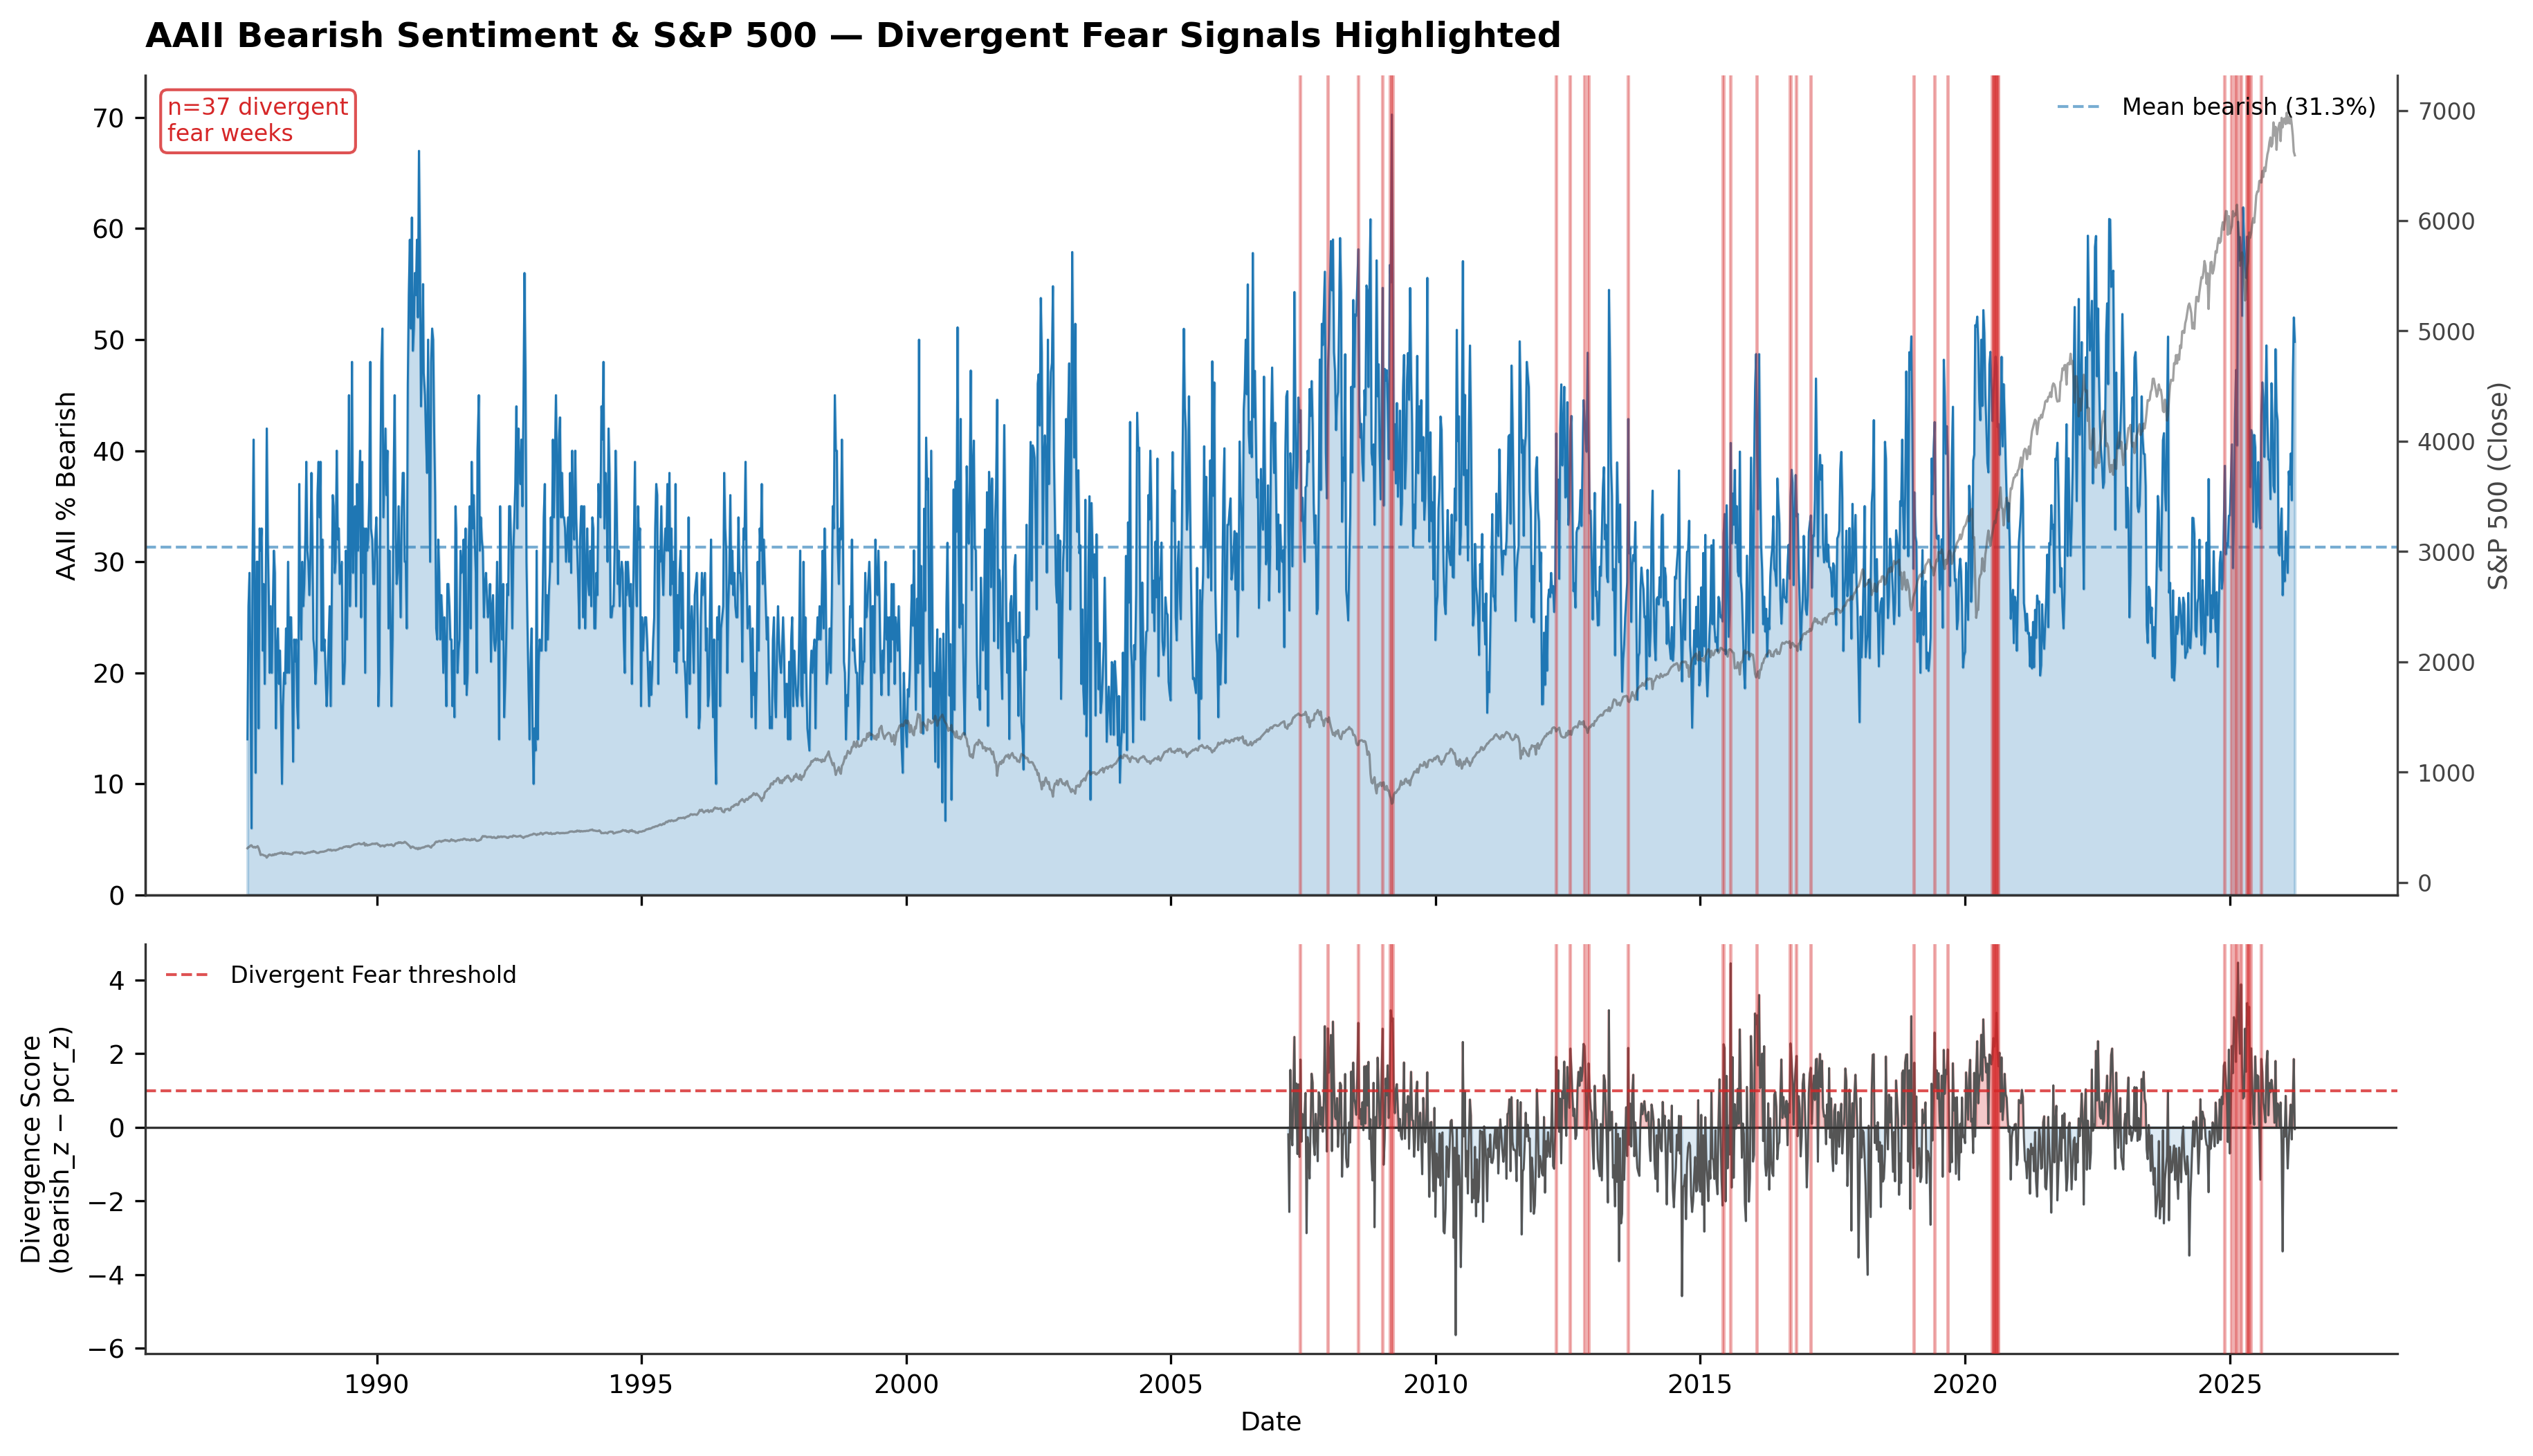
Divergent_fear clusters at moments of genuine retail panic unconfirmed by options market positioning. The forward return results:
Exhibit 8. AAII × PCR composite signal states: forward S&P 500 returns, 2006–2026 in-sample
| Signal | N | 26w Median | 52w Median | 52w Hit Rate |
|---|---|---|---|---|
| confirmed_fear | 90 | +4.5% | +11.8% | 70.9% |
| divergent_fear | 37 | +12.1% | +22.0% | 90.6% |
| neutral | 478 | +5.5% | +12.9% | 80.0% |
| quiet_hedging | 39 | +6.4% | +5.5% | 60.5% |
| confirmed_greed | 97 | +6.6% | +11.8% | 81.4% |
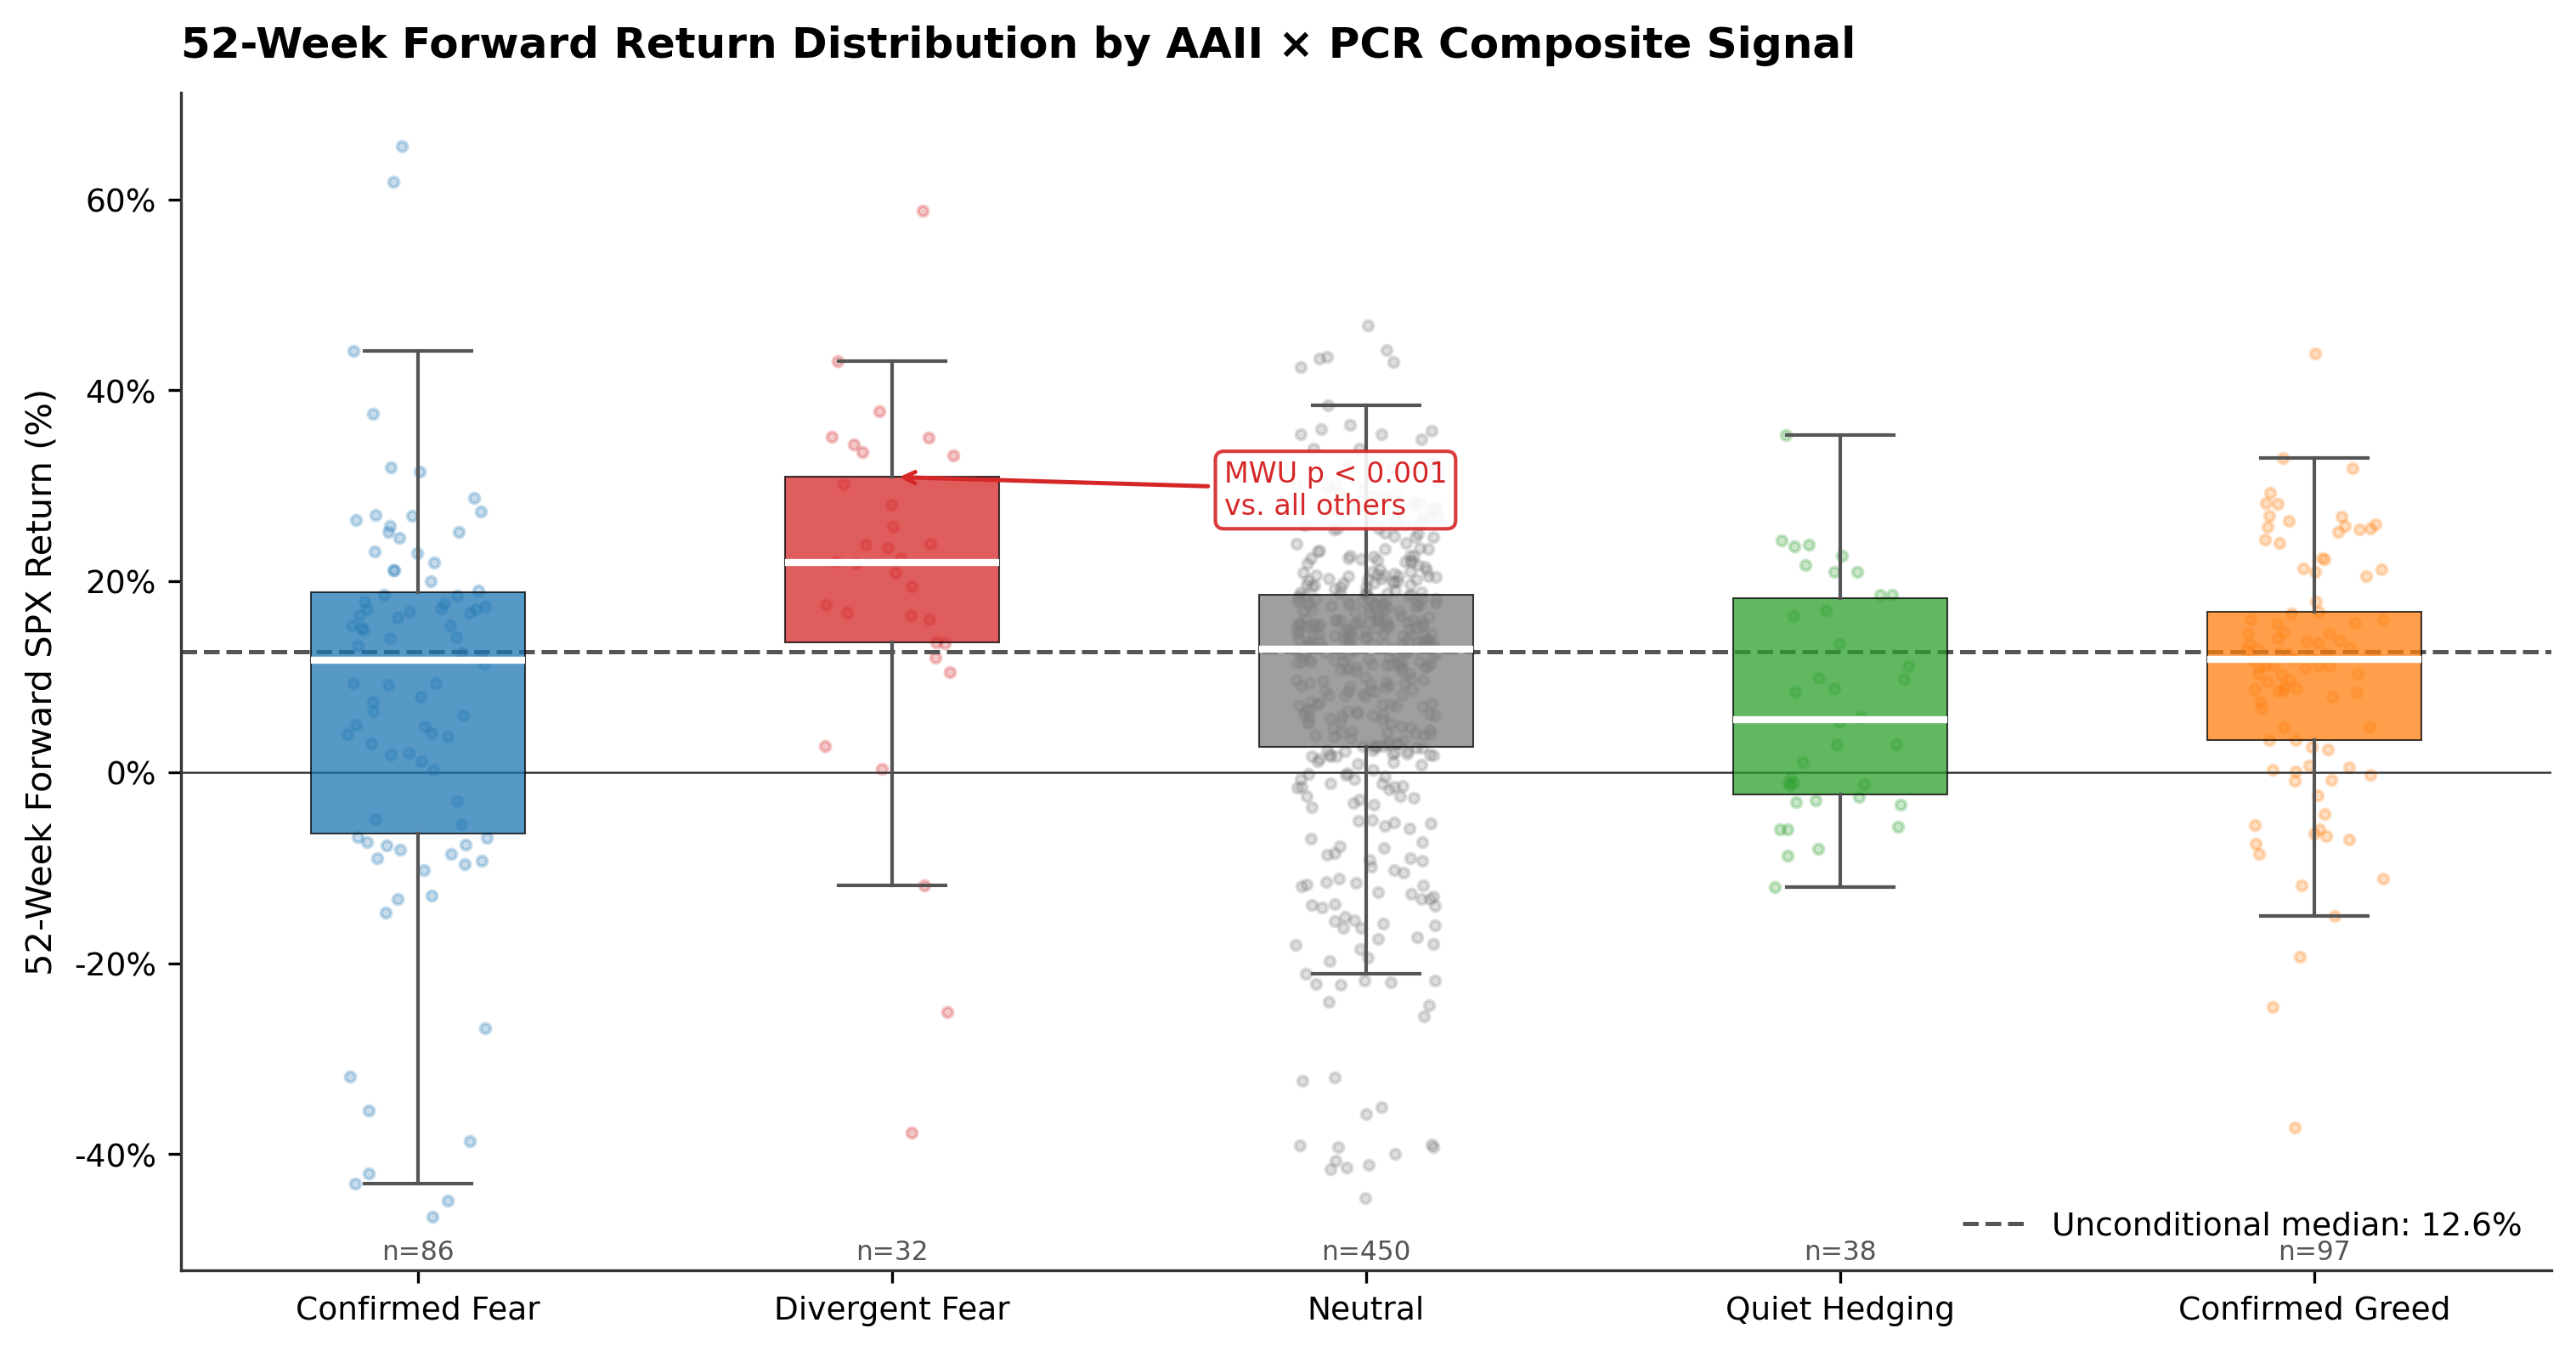
Exhibit 9. 52-week forward SPX return distributions by AAII × PCR composite signal bucket
The confirmed_fear bucket shows markedly lower performance at +11.8% over 52 weeks. This is exactly what the behavioural thesis predicts: when fear is structurally confirmed, the market has already partially priced it in. The quiet_hedging bucket (+5.5%, 60.5% hit rate) is the weakest result, consistent with covert institutional hedging being a more reliable signal of genuine risk than retail verbosity.
Conditioning divergent_fear on the VIX/VVIX regime produces the most extreme return results in the study. These results are in-sample only.
Exhibit 10. Divergent fear signal performance conditioned on VIX/VVIX regime, in-sample only
| Regime | N | 26w Median | 52w Median | 52w Hit Rate |
|---|---|---|---|---|
| consensus_low | 10 | +9.4% | +16.5% | 100% |
| latent_tension | 6 | +14.2% | +26.0% | 100% |
| active_fear | 5 | +16.6% | +34.3% | 100% |
| exhaustion | 3 | +15.7% | +24.0% | 100% |
In-sample only. N per cell 3–10; interpret directionally only.
Exhibit 11. Divergent fear performance by VIX/VVIX regime quadrant
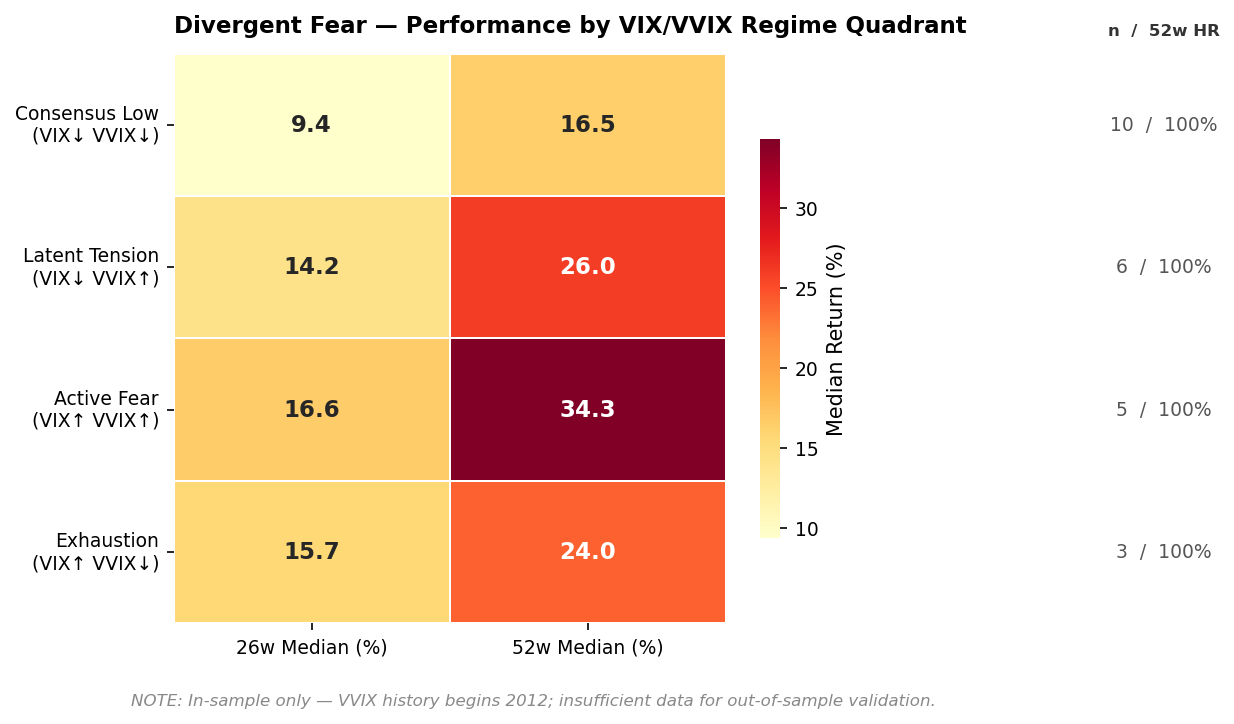
The active_fear result (verbal panic plus structural vol stress plus no institutional hedging confirmation) shows a 52-week median return of +34.3% with a perfect hit rate on N=5. This is consistent with genuine signal but also consistent with chance. The direction is compelling, but the statistical confidence is not sufficient.
7. Significance Testing
7.1 Non-Overlapping Sample Construction
Non-overlapping observations were constructed for each horizon by filtering to observations spaced at least N weeks apart. This produces independent observations at the cost of dramatically reducing sample size.
Exhibit 12. Raw versus independent sample sizes at the 52-week horizon
| Signal | Raw N | Independent N at 52w |
|---|---|---|
| extreme_fear | 192 | 24 |
| divergent_fear | 37 | 9 |
| confirmed_fear | 90 | 11 |
The collapse from 37 to 9 independent observations for divergent_fear is the central limiting factor for the binomial test at 52 weeks.
7.2 Mann-Whitney U Results
The MWU test was applied to all major signal buckets. Most signals did not produce statistically distinct return distributions. The results that passed:
divergent_fear: MWU p=0.000 at both 26w and 52w. The return distribution for divergent fear weeks is genuinely different from all other periods.
AAII bearish_z (extreme_fear bucket): MWU p=0.003 at 52w in-sample. Subsequently confirmed out-of-sample — see Section 9.
Exhibit 13. 52-week forward SPX return distribution: divergent fear vs. all other weeks
7.3 Binomial Test Results
The binomial test on non-overlapping observations produced no statistically significant results at conventional thresholds for any signal at 52 weeks. With N=9 for divergent_fear, the test has essentially no power to distinguish a true 90% hit rate from the ~84% base rate. This is not evidence against the signal — it is evidence that the sample is insufficient to confirm or disconfirm the hit rate claim.
8. Regression Analysis
8.1 Approach
A continuous divergence_score is regressed against forward SPX returns using Newey-West HAC standard errors with lag lengths set equal to the return horizon. This is the standard correction for autocorrelation from overlapping return windows in the return-predictability literature.
8.2 Results
Exhibit 14. Newey-West HAC regression of divergence_score on forward SPX returns
| Horizon | Coefficient | HAC Std Error | p-value | Significance |
|---|---|---|---|---|
| 4 weeks | +0.158 | 0.169 | 0.349 | — |
| 8 weeks | +0.296 | 0.286 | 0.300 | — |
| 12 weeks | +0.501 | 0.331 | 0.130 | — |
| 26 weeks | +1.127 | 0.595 | 0.059 | * |
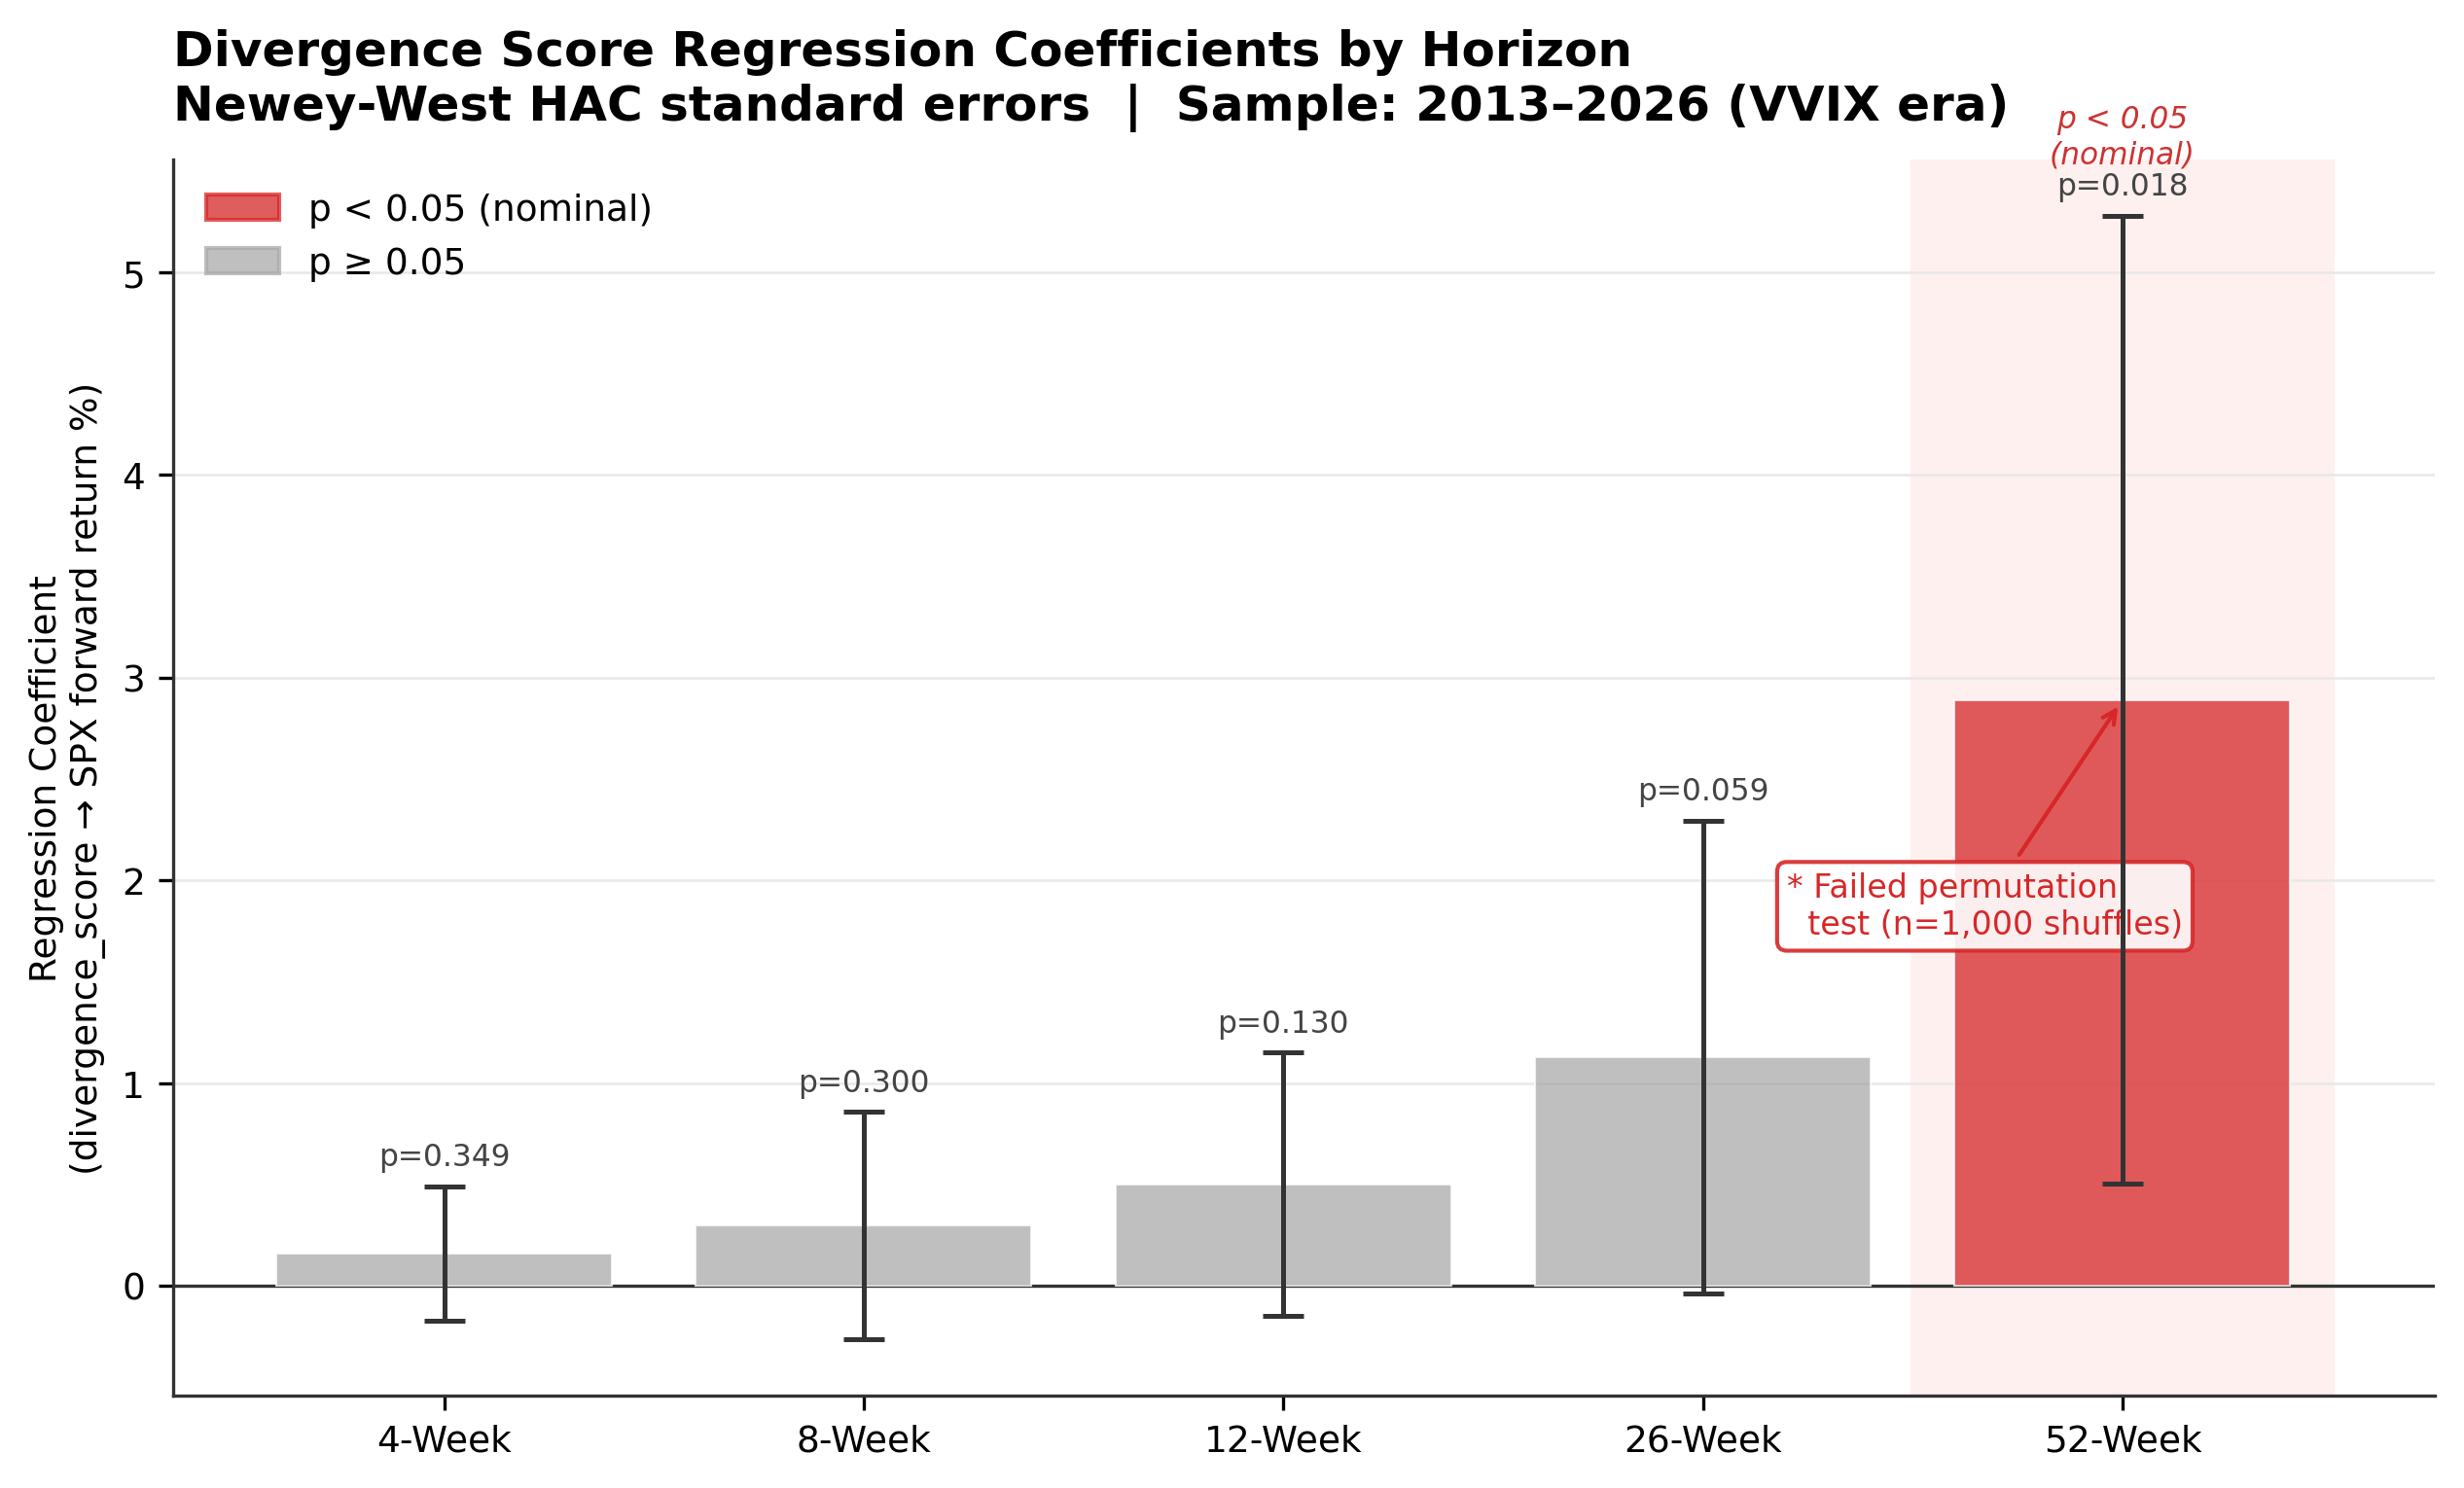
| 52 weeks | +2.891 | 1.218 | 0.018 | ** (fails permutation) |
* p<0.10, ** p<0.05 nominal. The 52-week result does not survive permutation testing; see Section 8.3.
8.3 Permutation Test: The p=0.018 Does Not Survive
Signal labels were shuffled 1,000 times and the regression re-run on each shuffle to test whether the 52-week result reflected genuine signal or data-structure artefacts.
Verdict: noise at every horizon. The p=0.018 at 52w did not survive permutation testing. The result was driven by two interacting artefacts: restricting the sample to the VVIX era selected a specific market period, and the joint regression of correlated predictors inflated the coefficient. On the full sample with shuffled labels, the observed coefficient was indistinguishable from chance. Newey-West correction addresses autocorrelation but not period-selection bias.
Exhibit 15. Regression coefficients by horizon with permutation test annotation
9. Walk-Forward Out-of-Sample Validation
Walk-forward validation is the most demanding test in this study. Parameters are calibrated on a training period, frozen, and the model is applied to a held-out test period it did not see. No re-fitting was permitted.
9.1 Test 1: AAII bearish_z Out-of-Sample (2006–2026)
Exhibit 16. Walk-forward Test 1: training and test parameters
| Parameter | Value |
|---|---|
| Training period | 1987–2005 (963 weeks) |
| Test period | 2006–2026 (1,055 weeks) |
| Calibrated bearish mean | 27.9% |
| Calibrated bearish std | 9.2% |
Exhibit 17. Walk-forward out-of-sample results — AAII bearish signal, test period 2006–2026
| Horizon | N | Base Median | Signal Median | vs Base | MWU p | Verdict |
|---|---|---|---|---|---|---|
| 4 weeks | 446 | +1.2% | +1.3% | +0.2% | 0.378 | — |
| 8 weeks | 443 | +2.3% | +2.8% | +0.5% | 0.010 | ** |
| 12 weeks | 443 | +3.4% | +4.3% | +0.9% | 0.001 | *** |
| 26 weeks | 434 | +6.8% | +7.7% | +0.9% | 0.001 | *** |
| 52 weeks | 412 | +13.4% | +15.4% | +2.0% | 0.000 | *** |
Parameters frozen at training-period values. ** p<0.05, *** p<0.01.
Exhibit 18. Walk-forward out-of-sample validation — signal vs. base rate median returns by horizon
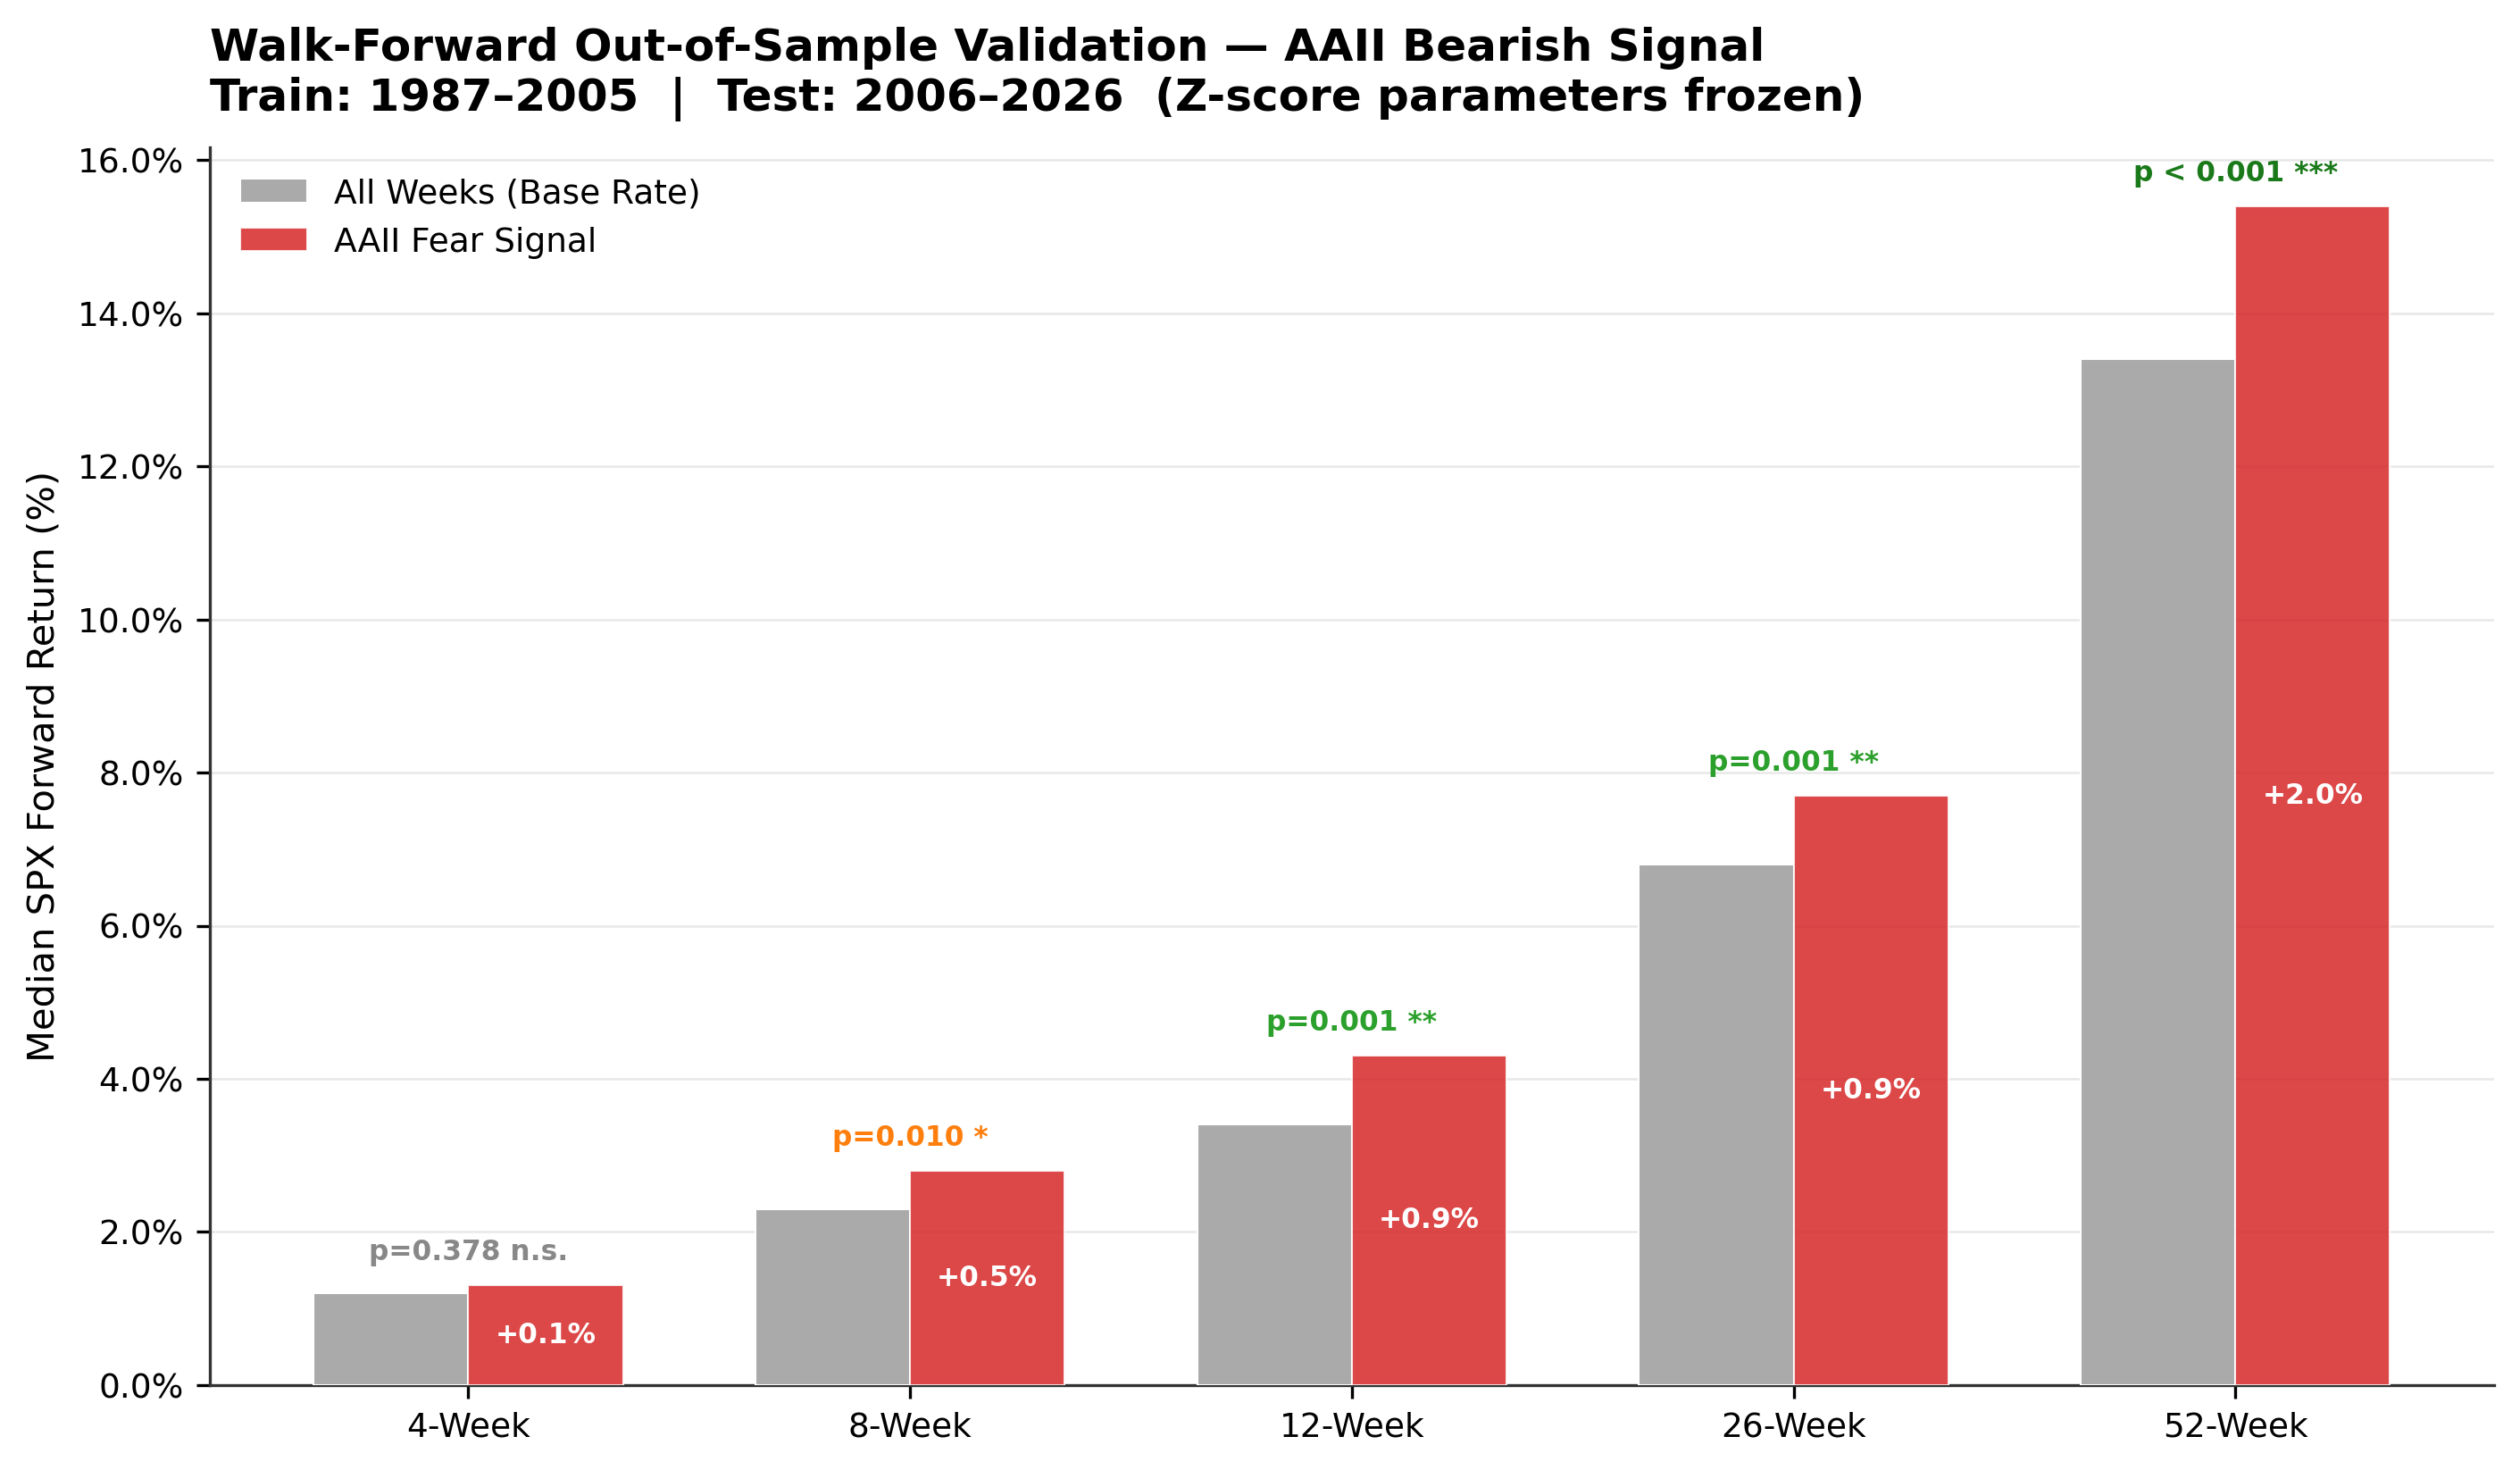
Exhibit 18 shows the cleanest result in the study. AAII bearish sentiment, classified using parameters calibrated exclusively on pre-2006 data, produces a statistically distinct return distribution over 8 through 52 weeks on 1,055 weeks the model never saw. Return differentials are modest (+0.9% at 12w, +2.0% at 52w) but real and robust.
9.2 Test 2: Divergence Score Out-of-Sample (2016–2026)
Exhibit 19. Walk-forward Test 2: training and test parameters
| Parameter | Value |
|---|---|
| Training period | 2006–2015 (479 weeks) |
| Test period | 2016–2026 (533 weeks) |
| Calibrated bearish mean | 34.4% |
| Calibrated bearish std | 9.6% |
| Calibrated PCR mean | 0.947 |
| Calibrated PCR std | 0.160 |
Exhibit 20. Walk-forward out-of-sample results; divergence score composite, test period 2016–2026
| Horizon | N | Base Median | Signal Median | vs Base | MWU p | Verdict |
|---|---|---|---|---|---|---|
| 4 weeks | 190 | +1.3% | +1.7% | +0.4% | 0.536 | — |
| 8 weeks | 188 | +2.9% | +3.4% | +0.4% | 0.104 | — |
| 12 weeks | 187 | +3.7% | +4.3% | +0.6% | 0.289 | — |
| 26 weeks | 176 | +7.5% | +8.7% | +1.2% | 0.019 | ** |
| 52 weeks | 154 | +17.5% | +16.0% | −1.5% | 0.001 | Mixed |
The 52w MWU is significant but the return differential is −1.5% vs. base. The signal fired frequently during a prolonged bull market that repeatedly bought back bearishness. Mixed result.
Adding PCR to AAII improves the in-sample story clearly, but the out-of-sample evidence is insufficient to claim the composite adds confirmed value over AAII alone. The composite signal is promising, not proven.
9.3 Walk-Forward Summary
Exhibit 21. Walk-forward validation summary across all signal layers
| Test | Horizons Validated | Return Differential | Verdict |
|---|---|---|---|
| AAII bearish_z OOS (2006–2026) | 8w through 52w | +0.9% to +2.0% | Holds. Clean OOS validation |
| Divergence_score OOS (2016–2026) | 26w (marginal) | +1.2% at 26w; −1.5% at 52w | Mixed. Not confirmed |
| VIX/VVIX regime overlay | Not testable | N/A. VVIX too short | In-sample observation only |
10. Integrated Verdict
10.1 What Walk-Forward Testing Changed
Exhibit 22. Before and after walk-forward testing: assessment of each signal layer
| Layer | Before Walk-Forward | After Walk-Forward |
|---|---|---|
| AAII signal | Directionally consistent in-sample | Out-of-sample validated at 8–52w |
| PCR divergence | Sharpens in-sample significantly | Promising; not OOS confirmed |
| VIX/VVIX regime | Compelling in-sample (+34.3% active_fear) | In-sample only — cannot test |
| Overall | Directionally right; not statistically proven | AAII layer is real; composite needs more data |
10.2 The Defensible Claims
AAII bearish sentiment has genuine out-of-sample predictive power over return distributions at 8–52 week horizons. Weeks where AAII bearishness is elevated relative to the prior two years have historically been followed by a statistically distinct and better return distribution on data from 2006–2026, using parameters calibrated exclusively on pre-2006 data (MWU p=0.000 at 52w). The mechanism is coherent: periods of extreme retail pessimism tend to coincide with sentiment-driven rather than fundamentally-driven selloffs, and these resolve faster.
When that bearish signal is also divergent from the options market — retail is scared but nobody is buying protection — the in-sample return distribution is more extreme (divergent_fear 52w median +22.0% vs. base +9.9%, MWU p=0.000). This composite signal is the most interesting finding but requires more data history to validate out-of-sample conclusively.
10.3 Practical Use of Each Signal Layer
Exhibit 23. Appropriate application of each signal layer
| Layer | Validated? | Appropriate Use |
|---|---|---|
| AAII bearish_z | Yes. OOS confirmed | Quantitatively backed signal; elevated readings have OOS-validated return distribution shift |
| AAII × PCR divergence_score | Partial. In-sample strong | Best live monitoring state; strongest in-sample precedent; treat with more weight than AAII alone, but acknowledge OOS limitations |
| VIX/VVIX regime | No. In-sample only | Structured context filter; use to calibrate conviction sizing, not to trigger decisions |
Exhibit 24. 52-week median return vs. hit rate by signal bucket
When the framework shows divergent_fear concurrent with an active_fear VIX regime, that is the highest-conviction setup the framework can produce. It is not a mechanical buy signal, but it is the historically strongest combination, and the AAII component underlying it has out-of-sample validation. The decision about how to act on it still requires judgment.
11. What Would Strengthen This Study
This paper is a beginning, not a conclusion. Five extensions would materially strengthen the framework, in approximate order of priority:
Longer VVIX History. VVIX only begins in 2012. The regime overlay is the most directionally compelling but least validated component. A longer VVIX history or reconstruction of a VVIX proxy from historical VIX options data would enable a proper walk-forward test of regime conditioning and settle whether active_fear genuinely improves signal performance or whether the N=5 result is noise.
Macro Regime Conditioning. Overlaying ISM, the Chicago Fed National Financial Conditions Index (NFCI), and credit spread data would allow testing whether divergent_fear performs differently in expansion versus stress environments. The hypothesis is that divergent_fear during macro stress is more reliable because the sentiment overshoot is harder to sustain against a recovering fundamental backdrop.
Valuation Control (Shiller CAPE). A persistent alternative explanation for the AAII bearish_z result is that periods of high retail bearishness tend to coincide with cheaper markets, and the return premium is a value premium rather than a pure sentiment premium. Adding Shiller CAPE as a control variable in the regression would allow partial isolation of the sentiment effect from the valuation effect.
Equity PCR vs. Index PCR Decomposition. This study uses the CBOE Total Put/Call Ratio, which aggregates equity and index options. Index PCR ($CPCI) is heavily influenced by institutional tail-risk hedging programmes independent of directional view. Equity PCR ($CPCE) is a cleaner proxy for directional sentiment. Separating the two series would likely sharpen the divergence signal and reduce noise in the current PCR measure.
Alternative Sentiment Cross-Checks. The NAAIM Exposure Index (professional money managers' equity exposure) provides a complementary cross-check on AAII. High divergence between AAII bearishness and high NAAIM exposure would strongly confirm the divergent_fear thesis: retail panicking while professionals remain allocated.
12. Conclusion
This paper set out to answer the question: do publicly available behavioural finance signals — AAII sentiment, PCR positioning, VIX/VVIX regime — carry information about forward S&P 500 returns that is statistically distinguishable from noise? The answer is a yes for the AAII signal alone, a conditional yes for the composite divergence signal in-sample, and an honest not-yet for the regime overlay.
The AAII result is the most interesting and important finding. Based on one simple signal — weeks where retail bearishness is elevated relative to its own recent history — we can produce a statistically distinct return distribution on 20 years of data out of sample. The return premium was modest (roughly 1–2 percentage points above base at 12–52w) but tangible.
The result of the composite divergence signal was theoretically coherent and empirically striking. A 52-week median return of +22.0% versus +9.9% base, with a statistically distinct distribution, is not noise. However, its out-of-sample validation is incomplete, and the permutation test result on the continuous regression is a negative finding that cannot be glossed over.
The vol regime overlay is a compelling framework. The hypothesis that divergent_fear during active vol stress represents the maximum contrarian setup is theoretically sensible and directionally supported. However, it cannot be validated yet.
Psychology moves markets. Sentiment divergence leaves traces in return distributions. This study establishes that with appropriate methodological rigour. The work of building those observations into a robust, validated investment framework is the next step.